
Private Credit Strategies When Global Liquidity Is Past Peak
Global liquidity just hit roughly $188 trillion. On the surface, that sounds supportive for risk assets.
But the smartest money in the room is doing something very specific with that information: getting more selective, not more aggressive.
This piece explains why the global liquidity cycle matters more than the latest headline, why we believe we are past peak, and why private credit strategies focused on real-world assets, structured yield, and disciplined capital allocation can offer a different approach to late-cycle risk.
What Is Global Liquidity and Why It Actually Drives Markets
Global liquidity is the aggregate financial “fuel” that can flow through markets—across central banks, commercial banks, money markets, and key funding channels.
Think of it as the capacity of the system to extend credit, roll debt, finance risk, and absorb shocks.
How global liquidity is measured in practice
There is no single universal definition, but institutional investors typically look at combinations of:
- Central bank balance sheets and reserves
- Monetary aggregates and bank reserves
- Cross‑border capital flows
- Money market and repo funding conditions
On top of the headline aggregates, sophisticated desks track deeper measures such as the Shadow Monetary Base—an attempt to capture the real, deployable financial firepower in the system once you strip out some of the accounting noise.
Why liquidity is a leading indicator for risk assets
Risk assets are not driven only by earnings, narratives, or politics. They are constrained and amplified by the liquidity cycle.
Historically:
- When global liquidity rises, risk assets tend to trend higher. Credit spreads compress. Equity multiples expand. Speculative assets catch a bid.
- When global liquidity stalls or falls, the opposite happens. The marginal buyer disappears. Volatility rises. Beta looks less like a free ride and more like a levered bet on refinancing conditions.
In short: liquidity is one of the cleanest leading indicators in finance. It does not time every move, but it shapes the entire distribution of outcomes.
The Current Global Liquidity Picture: High Level, Weak Momentum
The headline: global liquidity is high, but momentum is weakening.
That distinction matters far more than the absolute number.
Liquidity at $188T: headline strength vs underlying trend
Recent readings put global liquidity around $188 trillion. In isolation, that sounds constructive.
But markets don’t price the level. They price the change.
Under the surface:
- Liquidity ticked up slightly last week.
- Short‑term momentum is weakening.
- Annual growth sits below recent highs.
In other words, we are no longer in the easy part of the cycle where liquidity is clearly and consistently expanding.
What the Shadow Monetary Base is signaling
The Shadow Monetary Base—a deeper, more nuanced gauge of real system liquidity—just printed negative three‑month growth.
That is not a crisis signal on its own. It is, however, consistent with the idea that:
- The pace of liquidity expansion has stalled.
- The system may have already passed peak liquidity for this cycle.
For investors running size, the inflection matters more than the level.
The role of dollar weakness, Fed flows, and volatility
If momentum is soft, why haven’t markets cracked?
Because several forces are still supporting liquidity on the margin:
- A weaker U.S. dollar eases pressure on dollar‑funded borrowers globally.
- Fed liquidity has been modestly supportive.
- Bond market volatility has fallen sharply.
- The MOVE index dropped from roughly 115 to ~75.
- Lower volatility feeds into lower risk premiums on collateral, which in turn frees up capital.
Those positives help explain why risk assets have bounced. But they don’t change the bigger picture: the liquidity ceiling looks closer than the consensus narrative implies.
Central Banks Are Off-Sync: Why the Liquidity Tailwind Is Fading
Global liquidity is not controlled by one central bank. It is the net result of several major players moving in different directions.
Right now, that mix is less supportive than the headline numbers suggest.
Bank of Japan, ECB, BOE: quiet tightening and fragility
A few critical points from the current policy landscape:
- The Bank of Japan has shifted away from its most extreme easing stance and is in a tightening posture at the margin.
- The European Central Bank (ECB) is weak, constrained by growth, fiscal stress, and political fragmentation.
- The Bank of England (BOE) is similarly fragile, managing inflation, growth concerns, and a leveraged housing complex.
Individually, each of these may look incremental. Collectively, they amount to a fading tailwind for global liquidity.
China’s pause and what it means for global credit conditions
China’s central bank has paused fresh liquidity injections.
In prior cycles, aggressive Chinese easing helped offset tightening elsewhere. That is not the current regime.
Taken together:
- Japan is nudging tighter.
- Europe and the UK lack the balance sheet or political breathing room to flood the system.
- China is no longer leaning in.
The net result: the marginal global liquidity impulse is weakening, even as risk assets trade as if the easing cycle is still in full effect.
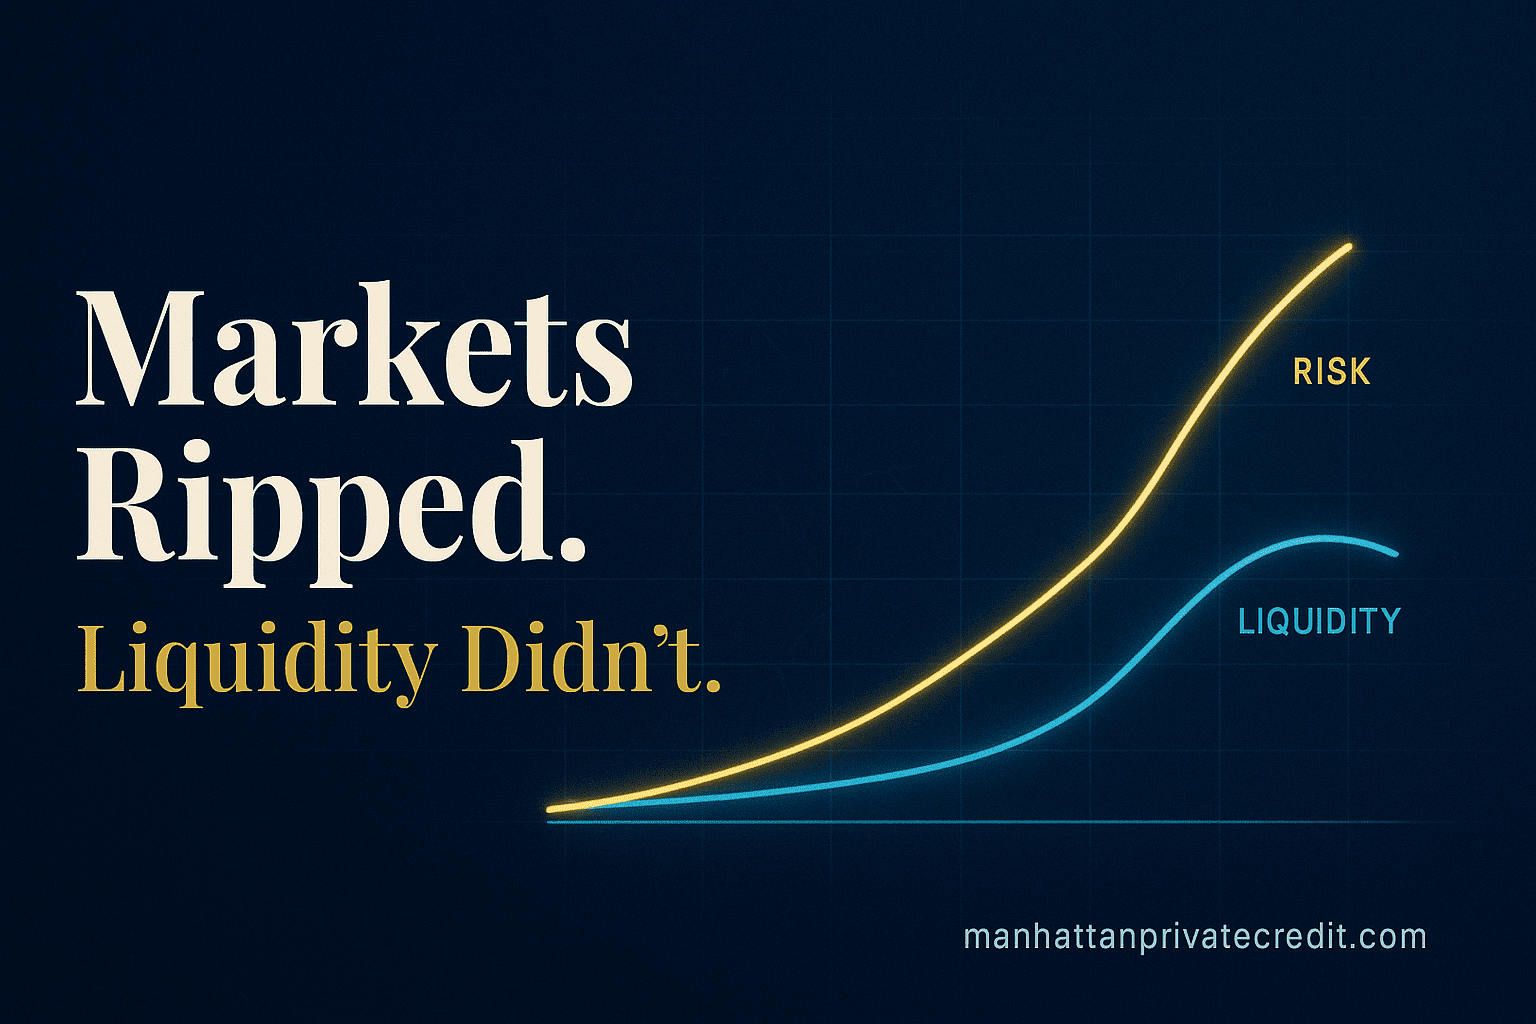
Markets Bounced, Liquidity Didn’t: The Sentiment–Substance Gap
Markets did what markets do. They looked through fear, digested the last geopolitical shock, and bounced.
Risk appetite is now back above pre‑conflict levels. Positioning and sentiment have normalized.
Liquidity has not.
Risk appetite is back above pre-conflict levels
Across multi‑asset flows, positioning, and volatility:
- Equity exposure has climbed.
- Credit spreads have tightened.
- Volatility has compressed.
On the surface, this looks like a classic “all clear” rally.
Underneath, the liquidity picture has not fully recovered alongside prices. That divergence is how late‑cycle traps are built.
Bitcoin, gold, and how assets tracked liquidity in Q1
Recent performance in key assets has been consistent with the liquidity data:
- Bitcoin largely followed liquidity down in Q1—reminding investors that it behaves more like a high‑beta liquidity thermometer than an uncorrelated store of value.
- Gold initially held up, then corrected, reflecting its dual role as both a hedge and a function of real rates and liquidity.
Different assets have different sensitivities, but the common denominator remains the same: the liquidity cycle.
Why consensus sees a ceiling on this rally
Among professionals, the broad view is taking shape:
- The recent bounce is real—earnings haven’t collapsed, and positioning was light.
- But the rally has a ceiling because we are likely past peak liquidity.
That is a very different thesis from “new bull market.”
In a past‑peak regime, rallies can be powerful but fragile. They are rallies to sell into or re‑underwrite, not to blindly leverage.
Why Chasing Beta in a Soft Liquidity Regime Is Mispriced Risk
In an environment where the global liquidity cycle has rolled over, the question isn’t: “Should I be in or out of markets?”
The real question is: “Where is my capital actually working, and what is it being paid to risk?”
The structural problem with beta in a liquidity headwind
Broad beta exposure (indices, passive risk-on baskets) carries several structural issues in this regime:
- Upside is capped by a fading liquidity tailwind.
- Downside is open‑ended if policy or liquidity takes another leg lower.
- You are paid the same as the crowd for taking essentially the same exposure.
In other words, late‑cycle beta is mispriced risk:
- You are not being compensated for liquidity risk.
- You are not being compensated for policy risk.
- You are not being compensated for refinancing risk embedded in broad credit and equity benchmarks.
That is acceptable for retail capital with long horizons and limited alternatives. It is less acceptable for accredited investors, operators, and allocators who know how to read a liquidity chart.
How professionals quietly de-risk into the ceiling
When professionals sense a liquidity ceiling, they rarely exit the market outright. Instead, they:
- Reduce gross beta while keeping idiosyncratic risk.
- Shift from unsecured or equity‑like risk toward collateral‑backed, structured positions.
- Shorten liquidity profiles where possible, avoiding being locked into long‑dated vehicles at late‑cycle valuations.
- Lean into event‑driven, capital‑structure, and basis trades that monetize specific dislocations rather than broad optimism.
This is where disciplined private credit strategies can become increasingly relevant as liquidity momentum weakens.
Private Credit Strategies for Real-World Assets and Structured Yield
If chasing broad beta into a liquidity headwind is the wrong question, what is the right one?
Where can capital earn premium yield, backed by real assets or events, with liquidity terms that reflect the current regime—not the last one?
Real-world, collateral-backed cash flows vs index beta
Real‑world assets—credit exposures tied directly to identifiable collateral and real economic activity—offer a different risk stack:
- Exposure to specific, underwritten cash flows, not just index earnings.
- Collateral and covenant frameworks that can be structured to protect downside.
- Returns driven by contractual payments, not only multiple expansion.
In a soft liquidity environment, that profile can be structurally superior to owning a broad index that is implicitly long central bank generosity.
Structured yield with faster liquidity than traditional private credit
Traditional private credit often comes with slow liquidity and rigid terms.
There is a growing space for structured yield that aims to improve that trade‑off:
- Targeting real‑world, event‑driven exposures rather than undifferentiated loan books.
- Building structures that recycle capital faster than classic 7–10 year private credit funds.
- Offering yield premia for complexity, sourcing, or structuring—not just for illiquidity.
In a world where global liquidity is past peak, being able to reprice and reallocate more frequently is an asset, not a luxury.
Event-driven and capital-structure-focused opportunities
When the broad tide stops rising, you stop being paid to own “the market.” You get paid to solve specific problems in the capital structure.
That is the core of event‑driven and capital‑structure investing:
- Financing or repricing companies around refinancings, recaps, asset sales, or M&A.
- Providing bespoke credit or hybrid capital where traditional lenders are constrained.
- Monetizing misalignments between equity, debt, and derivatives when liquidity is uneven across the stack.
These are not index trades. They are deal trades—and in a past‑peak liquidity regime, that is where attractive risk‑adjusted opportunities can concentrate.
How Sophisticated Investors Can Position Around the Liquidity Ceiling
Being “problem‑aware” about liquidity is not enough. The allocation architecture has to reflect that awareness.
Rethinking “fully invested” in a past-peak environment
For macro‑aware investors, “fully invested” should not mean “fully long beta.” Instead, it can mean:
- A deliberate mix of liquid hedges, selective beta, and structured yield.
- Room to add risk if liquidity unexpectedly re‑accelerates, rather than being forced sellers into weakness.
- An explicit recognition that headline valuations are being supported by a liquidity stock that is no longer growing.
Being fully invested in this environment is less about quantity of exposure and more about quality and structure of exposure.
Building an allocation map: beta, real assets, structured credit
A liquidity‑aware allocation map using selective private credit strategies might:
- Keep tactical, sized‑down beta where liquidity, positioning, and earnings still line up.
- Increase exposure to real‑world, collateral‑backed assets with robust underwriting.
- Allocate to structured, event‑driven credit and hybrid instruments that price in the current liquidity regime and offer faster capital rotation than legacy private vehicles.
The objective is simple: stop letting the global liquidity cycle be an unpriced externality and start treating it as a design variable in portfolio construction.
Conclusion: Private Credit Strategies Beyond the Liquidity Peak
Global liquidity is still high in absolute terms. But the cycle—the thing that actually drives marginal pricing—is softening.
- Short‑term momentum is weak.
- The Shadow Monetary Base is negative on a three‑month view.
- Central banks outside the U.S. are constrained or tightening quietly.
- Risk appetite has bounced harder than liquidity itself.
That gap between sentiment and substance is where late‑cycle mistakes are made.
In this environment, chasing beta is not a strategy. It is a hope that the last liquidity cycle will repeat on your timetable.
Private credit strategies centered on real‑world assets, structured yield, and event‑driven, capital‑structure‑focused exposures offer a different path: one where cash flows and structure, not just central bank generosity, do the heavy lifting.
Manhattan Private Credit focuses on that conversation.
Learn more at manhattanprivatecredit.com.
FAQ: Global Liquidity and Private Credit Strategies
What is global liquidity and why should investors care?
Global liquidity is the aggregate pool of money available to flow through the world’s financial system—across banks, central bank balance sheets, money markets, and key funding channels. When that pool is expanding, it tends to support higher valuations, tighter spreads, and stronger risk appetite. When it flattens or contracts, beta becomes fragile, drawdowns accelerate, and capital that depends on easy refinancing conditions is exposed.
How does global liquidity affect risk assets like equities, credit, and Bitcoin?
Risk assets are effectively claims on future cash flows that must be financed and discounted. When liquidity rises, financing is cheaper, balance sheets are more flexible, and investors are pushed out the risk curve—supporting higher prices for equities, credit, real assets, and even speculative assets like Bitcoin. When liquidity momentum weakens, that tailwind disappears. In Q1, Bitcoin tracked the liquidity downtrend while gold held and then corrected, showing how sensitive different assets are to the same underlying liquidity pulse.
If global liquidity is near $188 trillion, why is this still a problem?
The absolute level of global liquidity is high, but markets trade on the direction and momentum of that liquidity, not just the stock. Recent data shows soft short‑term momentum, annual growth below recent highs, and negative three‑month growth in the Shadow Monetary Base. In other words, we may be past peak in this cycle. Late‑cycle rallies can look strong right as the underlying fuel starts to fade.
Why is chasing broad beta risky in a past-peak liquidity environment?
Broad beta relies on the assumption that capital will keep flowing into indexes, refinancing will stay easy, and risk premiums will remain compressed. In a past‑peak liquidity regime, those assumptions weaken. Upside becomes capped as liquidity stops expanding, while downside remains very real if conditions tighten further. That is an asymmetric, late‑cycle profile: limited incremental return potential with meaningful drawdown risk attached to headlines and policy shifts.
Which private credit strategies are better suited to a weakening liquidity cycle?
Private credit strategies anchored in real‑world, collateral‑backed cash flows and structured yield can be better aligned with a soft liquidity environment. That includes select private credit and structured credit with faster liquidity than traditional buy‑and‑hold vehicles, as well as event‑driven and capital‑structure trades that monetize specific corporate or financing events rather than broad market drift. The objective is to be paid for complexity and underwriting, not for passively riding a crowded liquidity wave.
How should sophisticated investors incorporate global liquidity into their process?
For institutional and accredited investors, global liquidity should sit alongside rates, spreads, and earnings in the core macro dashboard. It can inform how much beta risk to run, where to size gross and net exposures, and when to rotate toward structured, idiosyncratic, or event‑driven positions. Liquidity is not a trading signal on its own, but in late‑cycle phases it becomes a critical context variable for capital allocation and risk management.